This section has been slightly truncated on the website. Request the full dissertation here via the Contact button.
Sample Size & Demographics
I surveyed 76 Instagram users who I personally know or know through a friend. The sample is therefore relatively small and non-representative. However, the significance of these findings should not be understated. The data tracks with previous findings regarding the impact of social media use on well-being, and reveals new findings about the variables that impact well-being.
Due to the relatively homogenous sample of survey participants, demographic factors did not appear to impact an individuals’ reasons for using Instagram, engagement levels on the platform, nor the likelihood that an individual uses Instagram for personal versus professional purposes. This may be explored in future research.
I emphasized employment information, specifically the industry in which participants worked, in order to test my hypothesis that participants working in the Marketing & Advertising industry would demonstrate a higher level of awareness of social media as a marketing channel, resulting in more positive associations with Instagram compared to participants’ working in “Other” industries.
38% of participants worked in the Marketing and Advertising industry, followed by 16% in Media & Telecommunications.
The remaining 42% of participants worked in a wide variety of industries: an equal percentage of participants were in Manufacturing (9%) and Healthcare (9%), 7% were in finance, an equal percentage of participants were in Food (3%), Education (3%), Engineering (3%), and Transportation & Logistics (3%), and equal percentage of participants were in Sports (1%), Nonprofit (1%), Publishing (1%), Fashion (1%), Real Estate (1%), Retail (1%), Fine Arts (1%), and Recreation & Travel (1%) industries.
The remaining 4% of participants did not answer this question.

Photo by Kiki Van Son

Photo by Kiki Van Son
Awareness of Instagram as a Marketing Channel and Perceived Value
Participants’ account type on Instagram was an additional factor used to determine their level of awareness of social media as a marketing channel. Participants were asked to specify whether they used a Personal Profile, a Professional Account, or Both. Participants who selected Professional Account or Both were asked to further specify what type of Professional Account they had, Business or Creator. Similar to participants working in the Marketing & Advertising industry, my hypothesis was that participants with Professional Accounts would show higher levels of awareness of social media as a marketing channel, because the Professional Account feature suggests they are leveraging Instagram as a tool to either grow their business (with a Business account) or their platform (with a Creator account).
Creator categories of participants included: ‘Artist,’ ‘DJ,’ ‘Blogger,’ ‘Photographer,’ ‘Digital Creator,’ and ‘Public Figure.’
Business categories included: ‘App Page,’ ‘Arts & Entertainment,’ ‘Beauty, Cosmetic & Personal Care,’ ‘Community,’ ‘E-Commerce Website,’ ‘Entrepreneur,’ ‘Food & Beverage,’ ‘Health/Beauty,’ ‘Jewelry/Watches,’ ‘Product/Service,’ and ‘Sports & Recreation.’
Overall, a greater number of participants had Personal Profiles on Instagram (65%). A smaller percentage of participants indicated that they had Professional Accounts (9%), or Both personal profiles and professional accounts (26%). [Figure 1] These proportions should be taken into account with the findings, as an unequal volume of participants for each account type may weigh results differently. To validate these findings, future research should seek to sample participants evenly across all account types.
Figure 1.

Differences in attitudes toward Instagram and perceived value of Instagram were seen among participants’ with different account types.
Participants were asked to recall whether or not they had considered deleting the Instagram app in the past 30 days. This question was intended to gage negative attitudes toward Instagram. They were then asked to recall whether or not they had considered creating another Instagram account in the past 30 days. This question was intended to gauge positive attitudes toward Instagram.
Participants with Personal Profiles answered “Yes” to ‘deleting the app’ at the highest rate of 33%, while 0% of participants with Professional Accounts considered deleting the app in the past 30 days.
Professional Account users were instead most likely to answer “Yes” to ‘creating another Instagram account,’ at 29%.
An equal percentage of participants with Both a personal profile and professional account on Instagram answered “Yes” to ‘deleting the app’ (15%) and “Yes” to ‘creating another Instagram account’ (15%). This makes the differences seen between those with either only a Personal Profile or only a Professional Account more significant. [Figure 2A-2B]
Following my methodology, Instagram users with a Professional Account demonstrated more positive attitudes toward Instagram than users with Personal Profiles.
Figure 2A-2B.


To supplement my methodology around user attitudes toward Instagram, I then asked participants directly to indicate their level of agreement to the following statement: “Instagram adds value to my life.” I then compared levels of agreement by account type. [Figure 3]
Overall, a higher percentage of participants with Professional Accounts (86%) agreed to some extent that Instagram adds value to their lives than participants with Personal Profiles (74%).
Participants with Personal Profiles were 2x more likely to ‘Strongly Disagree’ (12%) that Instagram adds value to their life than ‘Strongly Agree’ (6%).
Figure 3.

In order to advertise on Instagram, users must create a Professional Account, as either a ‘Business’ or ‘Creator’, or convert their Personal Profile to a Professional Account. Participants who indicated that they have a Personal Profile were then asked to answer (Y/N) to the question: “Before this survey, were you aware of the option on Instagram to convert your profile to a Professional Account (‘Creator’ or ‘Business’)? This question was for the purpose of evaluating participants’ awareness level of Instagram as a marketing channel, and using this distinction to reveal potential differences in perceived value of Instagram among users with Personal Profiles.
Awareness of the Professional Account feature on Instagram appeared to correlate with higher levels of perceived value among personal users.
A slightly higher percentage of participants with Personal Profiles were in fact aware of this option. [Figure 4]
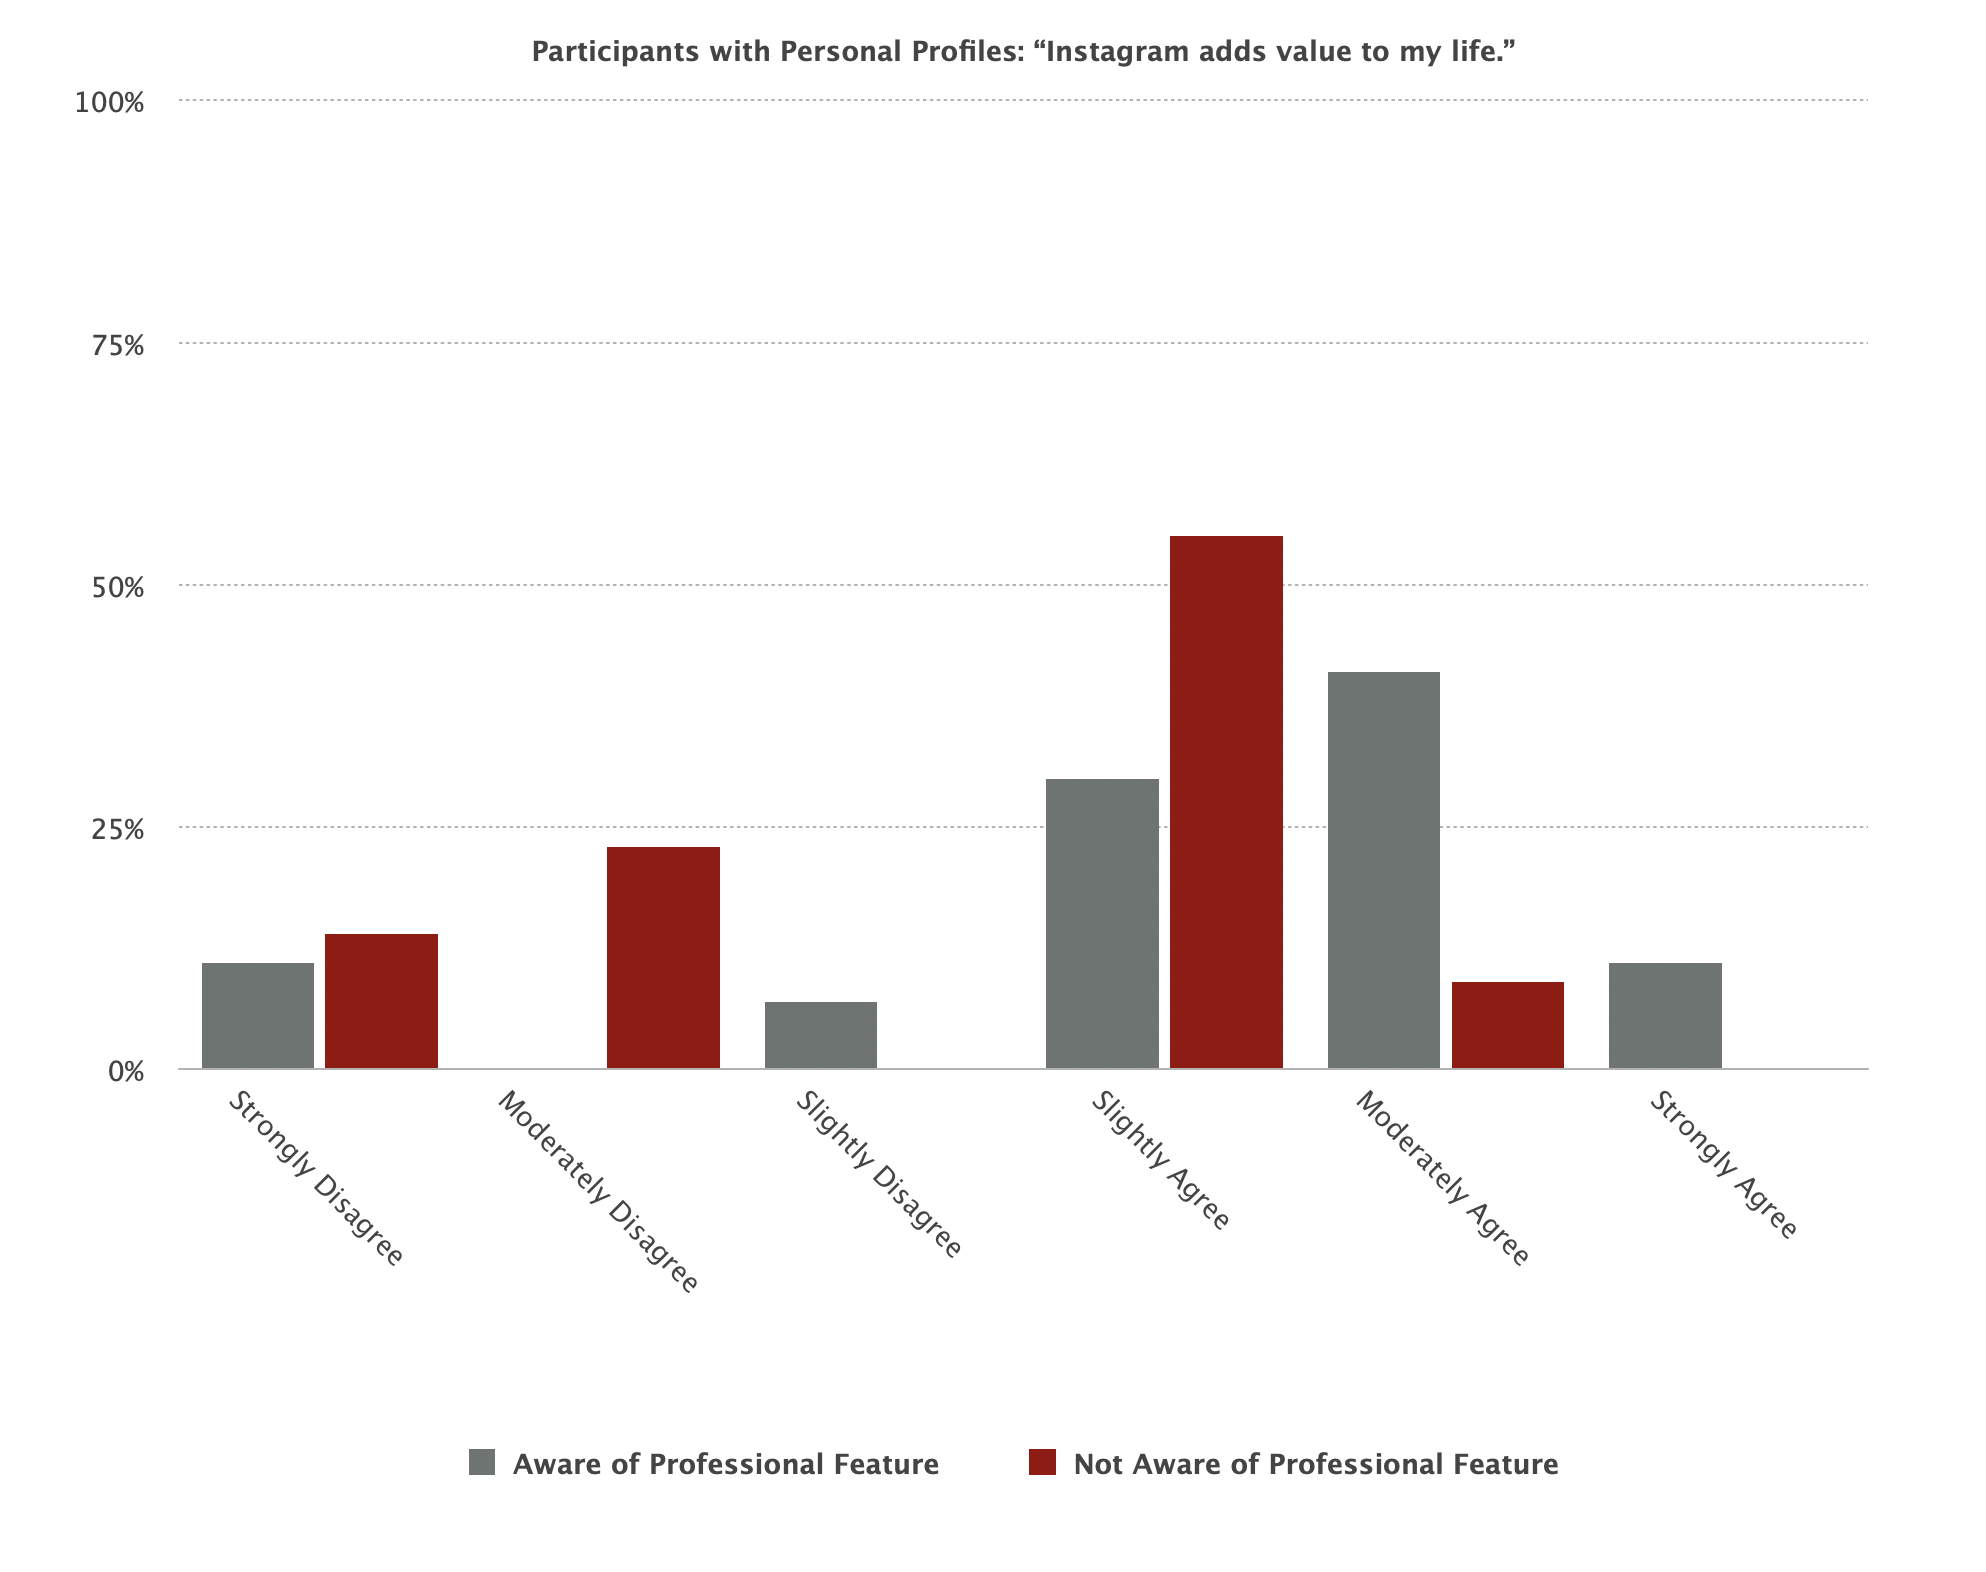
The percentage of participants with Personal Profiles who agreed to some extent (slightly, moderately, or strongly) that Instagram adds value to their lives was highest among those who were aware of the option to convert a personal profile to a professional account on Instagram. [Figure 4-4A]
Figure 4-4A.

When looking at all users with Personal Profiles, 27% disagreed that Instagram adds value to their lives. When looking at only Personal users who indicated that were not aware of the Professional Account feature on Instagram, the percentage of participants with Personal Profiles who disagreed that Instagram adds value to their lives increased from 27% to 36%. [Figure 4B]
Figure 4B.

In this way, awareness of the Professional Account feature showed to impact personal users’ perception of the value Instagram added to their lives. This may indicate a higher level of awareness of Instagram as a marketing channel, and therefore lend itself to attitudes or behaviors on the app that may help mitigate negative impacts on well-being.
When awareness of the Professional Account feature on Instagram was viewed through the industry participants’ were employed in, Personal Profiles who were aware of this feature were more likely to work in the Marketing & Advertising industry. [Figure 5]
Personal users who were aware of this feature were more likely to work in the Marketing & Advertising industry.
Figure 5.

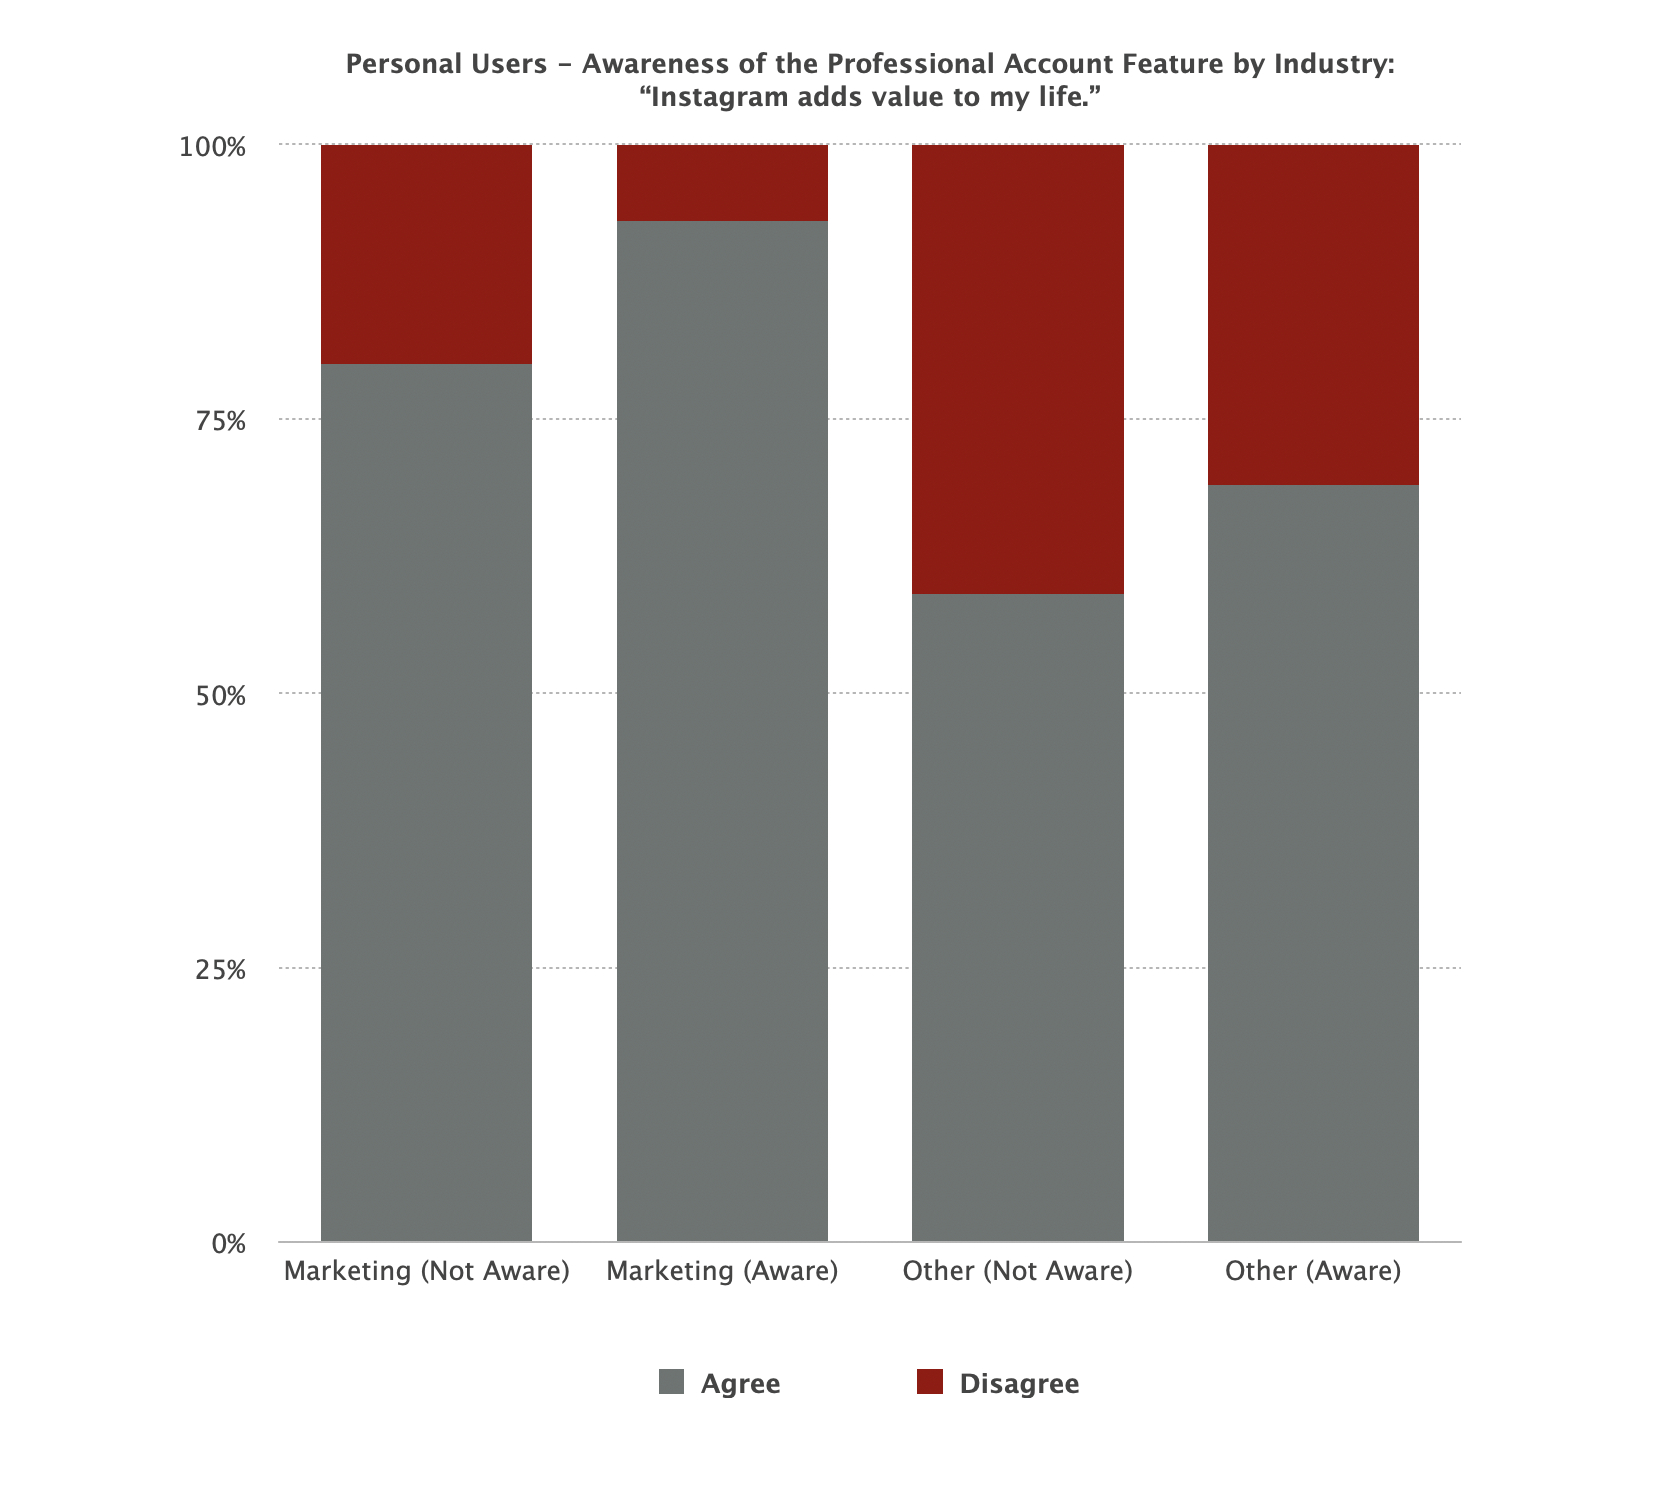
However, awareness of the Professional Account feature among participants with Personal Profiles increased perceived value of Instagram regardless of industry. For personal users working in Marketing & Advertising, those who agreed to some extent that Instagram added value to their lives jumped from 80%, for those who were not aware of the Professional Account feature, to 93% for those who were aware. For personal users working in Other industries, agreement jumped from 59% to 69%. [Figure 5A]
Figure 5A.
Overall, personal users working in the Marketing & Advertising industry were more likely than participants who working in Other industries to agree that Instagram adds value to their life.
Overall, personal users working in the Marketing & Advertising industry (both those who were aware and those who were not aware of the Professional Account feature on Instagram) were more likely than participants who worked in Other industries to agree that Instagram adds value to their life.

Photo by Kiki Van Son
Influences on Passive vs. Active Engagement
My research design makes the assumption that what makes Marketing & Advertising industry professionals similar to Instagram users with Professional Accounts is their awareness of social media as fundamentally a media channel, and a business driven by financial incentives to sell advertising.
Additionally, I am testing the assumption that what makes these two types of Instagram users different than the average Instagram consumer is their level of engagement while using the app. The research to date shows that passive use of using social media has the most harmful effects on well-being. My hypothesis is that passive use is more common among users with Personal Profiles—both those who do not demonstrate an awareness of social media as a marketing channel, and those who indicate less purposeful reasons for using Instagram.
My hypothesis is that passive use is more common among users with Personal Profiles—both those who do not demonstrate an awareness of social media as a marketing channel, and those who indicate less purposeful reasons for using Instagram.
Participants were asked to choose their primary reason for using Instagram from a list of reasons that were more or less purposeful, with those that were less purposeful being more likely to lead to passive usage. For example, participants who selected “To learn new skills or knowledge” as their primary reason for using Instagram may be more likely to use the app intentionally, resulting in more active engagement, compared to participants who chose “To fill up spare time.” Participants who use the app actively may be more likely to engage with social media in a way that adds value to their lives, and less likely to waste time in the infinite scroll, for example, or become invested in other people’s highlight reels. Tracking with the research to date, participants who use the app actively will demonstrate higher levels of subjective well-being as it relates to social media use.
Reasons for Use
Primary reasons for using Instagram were explicitly broken out into 11 categories. Participants were asked to choose 1 of the 11 categories to signify their primary reason for using the app. (These categories reflect those used in a variety of standardized reports, such as GlobalWedIndex’s annual flagship report tracking global social media usage trends.)
These categories included: 1) To fill up spare time; 2) To find funny or entertaining content; 3) To grow my business; 4) To keep up with news and current events; 5) To learn new skills or knowledge; 6) To make sure I don’t miss out on anything; 7) To network with people in my profession; 8) To research new products to buy; 9) To share and promote my work/passions; 10) To share photos or videos of my experiences with others; 11) To stay in touch with what my friends are doing.
The most popular reason for using Instagram among 28% of participants was “To stay in touch with what my friends are doing.”
The most popular reason for using Instagram among 28% of participants was “To stay in touch with what my friends are doing,” followed by “To share photos or videos of my experiences with others” (18%), “To find funny or entertaining content” (17% ), and “To grow my business” (11%). The remaining 26% of participants selected “To fill up spare time” (7%), “To share and promote my work/passions” (5%), “To network with people in my profession” (4%), “To keep up with news and current events” (4%), “To research and find products to buy” (3%), “To make sure I don’t miss out on anything” (3%), and “To learn new skills or knowledge” (1%).
Due to a relatively small sample size overall, the categories signifying primary reason for use are disproportionately represented, with 5 participants or less representing 6 of the 11 categories. As with other components of my research, larger and evenly distributed sample sizes are needed to validate the results.
Reasons for Use by Account Type
Participants with Professional Accounts were the most likely to use Instagram with clear intentions.
I then looked at how many participants filtered into each reason for using Instagram based on the Account Type they had. There were more survey participants with Personal Profiles than participants with Professional Accounts or Both overall, therefore, Personal Profiles were likely to make up the majority of each ‘reason for use’ category. However, some subtle differences emerged that warrant further investigation. [Figure 6A]
There were 0% participants with Personal Profiles who selected “To grow my business” or “To learn new skills or knowledge” as their primary reason for using Instagram. On the contrary, participants with Personal Profiles were the most likely to use the app “To research and find products to buy” (100%), “To stay in touch with what my friends are doing (86%), and “To fill up spare time” (80%). These activities seem to be less focused and more likely to lead to passive use of the app.
On the other hand, participants with Professional Accounts were the most likely to use Instagram with clear intentions, “To learn new skills or knowledge” (100%) or “To grow my business” (50%).
Participants with Both a Personal Profile and a Professional Account seemed to strike more of a balance between activities revolving around their social lives and their work or passions. These participants were the most likely to use Instagram “To network with people in my profession” (67%).
This group was as likely as participants with Personal Profiles only to select “To make sure I don’t miss out on anything” (50%) and “To share and promote my work/passions” (50%); and as likely as participants with Professional Accounts only to select “To grow my business” (50%).
Figure 6A.

Post Engagement
To understand how participants’ primary reason for using Instagram impacted their level of engagement on the app, I designed the following formulas to identify active versus passive engagement. These formulas measure the rate at which participants share content themselves as well as engage with others on the platform, and the likelihood that they possess an understanding of the Instagram algorithm:
Post Rate. Participants answered whether or not (Y/N) they had posted to 1) their Instagram feed, and 2) their Instagram Stories in the past 30 days. I divided the amount of participants who answered “Yes” within each ‘reason for use’ category by the total number of participants in that category to determine the Feed and Story Post Rate for each group. This metric allowed me to identify differences in the rate at which participants posted based on their primary reason for using Instagram.
The difference between Story and Feed posts is that Story posts disappear 24 hours after posting. Story posts are more spontaneous, whereas Feed posts tend to be more curated. Stories are displayed at the top of a user's app when they're logged in, and are tapped through to view, while Feed posts are the collection of videos and images that make up a user’s profile and remain there indefinitely as a representation of the user.Users who post to their Stories more than their Feed may be less invested in sharing content themselves and more likely to yield to passive use of the app overall.
Participants who posted to their Stories at a higher rate than they posted to their Feed were those who use Instagram primarily ‘to stay in touch with what friends are doing’, ‘to share photos or videos of their experiences with others’, ‘to fill up spare time,’ ‘to network with people in their profession,’ and ‘to research and find new products to buy.’ These participants’ post rates suggest that they consume more information than they themselves share on the platform. This group may be more susceptible to social comparison, for example, which can harm an individual’s well-being through increased anxiety or poor self-esteem.
This is less likely the case for participants using Instagram primarily ‘to grow their business’ and ‘to share and promote their work/passions.’ This group posted to their Feed at a higher rate than they posted to their Stories. Those in the ‘grow my business’ category demonstrated among the highest post rates, along with those who use Instagram ‘to keep up with news and current events,’ ‘to learn new skills and knowledge,’ and ‘to make sure they don’t miss out on anything.’ These groups were the most active, with the highest post rates for both Feed and Story posts. [Figure 7A]
Figure 7A.

Understanding of the Instagram Algorithm
I also looked at the rate at which participants used additional features when posting on Instagram that are specifically designed to boost engagement with content. These features are relatively more advanced and less likely to be used by the average Instagram consumer, because using them assumes an understanding of how the Instagram algorithm works to rank content in social media feeds. These features include:
Hashtags. Participants were asked (on a scale of 1, “Never”, to 5, “Always”) how often they add hashtags in the caption or comments of their posts. Hashtags (e.g. #travel) filter posts into relevant content feeds on social media. Using a hashtag or multiple hashtags allows a user’s post to be discovered by someone outside of their Followers. For example, someone who is looking for travel ideas to plan a vacation may type “travel” into the ‘Search’ function of the app, and find your recently uploaded photo which included the hashtag #travel in the caption. In other words, hashtags enable people who share similar interests who are not already connected on the app to discover each other’s content and profiles. Additionally, hashtags increase engagement. Extending the reach of a post beyond a users’ network creates more potential opportunities for engagement with that post. More engagements, in turn, tell the Instagram algorithm to rank a post higher in the Feed. Instagram ranks content by engagement, because more engagement suggests user attention is being captured, which works to increase the amount of time people spend on the platform—Instagram’s bottom line.
Story Stickers. Participants were asked (on a scale of 1, “Never”, to 5, “Always”) how often they use Story Stickers (e.g. Poll, Questions, Countdown, Quiz). Stickers are interactive features and allow a user’s Followers to vote on their Poll, for example, with the touch of a button while browsing Story content on the app. Stickers drive additional engagements (in the form of Poll votes, answers to Questions, etc.) with content that can otherwise only be viewed. Additionally, participants were asked how often they used Filters, Text, or Music when posting to Instagram Stories.
Live. Live is like Instagram Stories, except video streaming in real-time. Using Live increases the chances a user’s Followers will view their streamed video, because Followers receive a notification when someone within their network goes ‘Live,’ and in addition, Live stories are placed in front of regular Stories on Instagram, therefore getting more visibility. Additionally, the urgency of ‘Live’, since it is not available for any set time as opposed to regular Stories which remain in the Story feed for 24 hours, increases the likelihood that people will tune in. Ultimately, Live is another feature that increases overall engagement.
There was not enough variation in engagement with these additional features to conclude that these differences were due to participants' reason for using Instagram. However, the highest use rate with these advanced features was among those who primarily use Instagram ‘to grow their business’ (55%). This tracks with my hypothesis that participants who use these features are most likely to possess an understanding of Instagram’s algorithmic system.
The highest use rate with these advanced features was among those who primarily use Instagram to grow their business. This tracks with my hypothesis that participants who use these features are most likely to possess an understanding of Instagram’s algorithmic system.
Search, Comment, Save, and Share. Lastly, participants were asked how often (on a scale of 1, “Never”, to 5, “Always”) they used the Search feature on Instagram. Search implies more active versus passive use because the user is seeking something out, whether that is someone’s profile, or specific content based on the location tagged or hashtag used.
Engagement with Others
Participants also signified how likely they were to Comment on posts, Save or Shares posts. These forms of engagement, as opposed to “Likes”, suggest a deeper level of engagement with the content or the person sharing it. Participants who posted average or above average engagement rates with others included those who use Instagram primarily ‘to grow their business,’ ‘to keep up with news and current events,’ ‘to learn new skills or knowledge,’ and ‘to make sure they don’t miss out on anything.’ These were the same categories which demonstrated higher post rates, suggesting both higher levels of engagement and therefore more balanced consumption of information on the app among these groups.
Additionally, the categories which suggested stronger intentions for use, such as those associated with personal or professional development, were also the most likely to use Instagram to find ideas and inspiration related to their work or hobbies. These categories included “To grow my business,” “To keep up with news and current events,” and “To learn new skills or knowledge.” [Figure 8]
Figure 8.

Participants who use Instagram ‘to share photos or videos of their experience with others,’ ‘to share and promote their work/passions,’ ‘to research and find products to buy’ and ‘to fill up spare time’ posted below average engagement with others.
Similar to the case with post rates, those who proclaim to use the platform for social purposes actually demonstrated low engagement rates with others, and therefore may be more susceptible to the potential negative impacts on well-being predicted by passive use of the platform.
Furthermore, those who ‘fill up spare time’ on Instagram will be less guided in their activity without a clearly defined reason for being on the app, and therefore more likely to succumb to design tactics intended to increase users’ time spent on the platform, such as the infinite scroll. [Figure 9]
Figure 9.

Post Frequency
I used one additional measure to determine participants’ level of engagement on Instagram. Participants were asked to signify how frequently they post. Post frequency was broken out into four quartiles for analysis: the highest frequency being “More than once a day” to “About one a day,” the second highest being, “A couple time a week” to “About once a week”, the second lowest being, “A couple times a month” to “About once a month”, and the lowest, “A couple times a year.” I then calculated the percentage of participants who fell into each quartile based on the Account Type they had: Personal Profiles, Professional Accounts, or Both. [Figure 10]
Participants with Professional Accounts were the most likely to fall into the first (57%) or second (43%) quartile, meaning they post the most frequently. The majority (57%) said they post “More than once a day” or “About one a day.” Zero participants with Professional Accounts fell into the two lower frequency quartiles.
Participants with Personal Profiles, on the other hand, were more likely to fall into the lower frequency quartiles, with 47% saying they post “A couple times a month” or “About once a month,” and 20% posting only “A couple times a year.” Still, 33% of participants with Personal Profiles demonstrated slightly higher post frequency, with 29% saying they post “A couple times a week” or “About once a week,” and 4% saying they post “More than once a day” or about “Once a day.” Therefore, using post frequency as a measure for active use, Professional users were more active than Personal users.
Participants with Both a Personal Profile and a Professional Account were more balanced across quartiles. The majority fell in the two higher post frequency quartiles (65%), while the remaining 35% fell in the lower two frequency quartiles.
Figure 10.

These formulas were intended to identify participants who were actively versus passively engaged on the platform. Using social media passively creates a one-sided experience for the individual, where they are consuming information without engaging with others or sharing information themselves, therefore undermining the potentially positive influences that social media provides.
In the final section of analysis, I compare the well-being scores of active vs. passive users to see if passive users showed higher levels of FOMO (Fear of Missing Out) and anxiety, and lower levels of autonomy, self-acceptance, purpose in life, and environmental mastery.

Photo by Kiki Van Son
Impacts on Well-Being
When looking at participants’ well-being scores in relation to their primary reason for using Instagram, three groups scored consistently high while two other groups scored consistency low. Those who use Instagram “To learn new skills or knowledge” scored the highest in “Self-Acceptance” (a positive attitude towards oneself and one’s past life), “Purpose in Life” (believing that one’s life is meaningful) and “Environmental Mastery” (the ability to manage one’s life). Those who use Instagram ‘to grow their business’ and ‘to network with people in their profession’ were a close second, with the two next highest scores in “Self-Acceptance” and “Purpose in Life.” Those who use Instagram ‘to network with people in their profession’ also scored highest in “Autonomy”.
Alternatively, those use Instagram ‘to make sure they don’t miss out on anything’ scored the lowest in “Autonomy,” “Self-Acceptance,” and “Environmental Mastery.” Just behind them, those using Instagram “To fill up spare time” scored low in “Environmental Mastery,” “Autonomy,” and “Self-Acceptance.” [Figure 12, 12A-12D]
Figure 12.

Figure 12A-12D.


While differences in these dimensions of well-being may be due to many factors outside of social media use, the way in which these users spend their time on social media is less directed and intentional than those who scored high in well-being, who on the contrary have specific goals associated with their Instagram use that enable personal growth.
If not the direct cause of worsened well-being, it is possible that social media acts as a crutch for those who feel less directed and in control of their lives, serving to keep them where they are by filling the cracks in their day with other people’s lives instead of making positive changes that may improve their own well-being.
My analysis of the data leads me to consider these possibilities, however, more research needs to be done to verify it.
These groups also scored higher in FOMO and anxiety. Participants who use Instagram ‘to make sure they don't miss out on anything’ ranked higher in FOMO (“Fear of Missing Out”) than any other group. This groups’ reason for using Instagram may contribute to the same feelings that causes them to find statements in this section of my survey, such as “I fear my friends have more rewarding experiences than me,” true of them. [Figure 11A] Furthermore, those who use Instagram “To fill up spare time” averaged the highest anxiety scores. [Figure 11B]
Figure 11A.

Figure 11B.

A closer look at participants’ screen time data suggests that many individuals have formed habits around their social media use which overwhelm their best intentions, and cause them to use their time in ways that do not benefit to their well-being.
Screen Time Data & App Limits
Only a fraction of all participants submitted their screen time data. For this reason, I cannot confirm whether someone’s reasons for using Instagram affects the amount of time they spend on the platform, nor report a relationship between time spent social networking and impacts on well-being.
However, for those who did submit screen time data, there was a positive correlation shown between the total time someone spent “Social Networking” in a given week, and the total time they spent on Instagram. (In addition to social media apps like Instagram, Facebook, Twitter, etc., Messages and FaceTime also fall under the category of “Social Networking” in Apple’s Screen Time tool where this data was sourced). [Figure 13]
Figure 13.

App Limits
Of the survey participants who submitted their screen time data, 70% of iPhone users and 100% of Android users do not set time limits on any of their apps using Apple’s Screen Time and Android’s Digital Wellbeing tool, respectively.
Of the 30% of iPhone users who did confirm use of the Screen Time tool to set app limits, 100% of participants said they limited Instagram use.
Following Instagram, Facebook was the next most limited social networking app (36%), followed by an equal percentage of participants who limit their time on Facebook Messenger (29%) and Snapchat (29%). A smaller, but still notable, percentage of participants limit their time equally on Email, Twitter, YouTube, and Text Messaging as well (14%). Participants limit Pinterest and WhatsApp use least (7%).
Negative Impacts of Social Media
Perceptions of wasted time is a factor that negatively impacts individual well-being and is more associated with passive use of social media. This tracks with what I found. More than half (53%) of all participants stated that increased time spent online was among the most negative impacts of social media on their lives. It follows that participants may therefore possess a desire to change how their time is being spent online and on social media, making it more surprising that few make use of the Screen Time and Digital Well-Being tools.
80% of these participants explicitly stated that social media “increases screen time” and described time spent on social media as “wasted”. “Consumed time” and “time suck” were additional phrases used by this group.
The other 20% more accurately suggested their time was not well spent on social media, by describing it as a “distraction” from “things that matter the most”—such as “the real world,” “face to face interactions,” and “the present moment”. These participants lamented that social media took the place of more enriching activities, such as “physical activity” and “reading a book.”
Many of these participants further acknowledged the mental and physical consequences of spending too much time on social media, including “lack of concentration” and “lack of productivity,” as well as “feeling not good enough” and “not spending enough time” on oneself. What is most significant about these answers is the evidence of awareness demonstrated by these participants of their behaviors, and the negative impact these behaviors have on their lives. [Figure 14A-B]
Figure 14A.

See here for detailed answers on the most positive and negative influences social media has had on participants’ lives.